Table of Contents
Dimona's & Contracts dashboard
Introduction
Through our integration with Luzmo we offer our Pro plan clients the possibility to get a visual overview of your data through a number of different dashboards.
This module contains 6 dashboards by default that give you an analytical insight into your data from companies, Dimona's & contracts (if active), invoicing (if active), operations, projects and employees.
If you wish to use this integration, activate it on the INTEGRATIONS page and select the dashboards you want to use. After activating, select the permission View Luzmo (administration section) for every manager who is allowed to view these dashboards.
If you wish to create additional dashboards with other data, please contact [email protected] .
General usage
To consult your dashboards, navigate to DASHBOARD in the menubar on the left.
As soon as the Luzmo module has been activated, a pop-up will appear in which you can select the desired dashboard:
On each dashboard you will find different graphs and tables, each with their own layout. The data you will find in each field is self-explanatory and is further explained by the titles and legends.
Filter data
At the top of each dashboard page, you have a number of filters available that allow you to select the data you want. The results are then displayed in the graphs and data fields.

The graphs and tables are also interactive, meaning that you can select different parts and the data in the other fields will also adapt according to this selection.
For example, you can select a pie slice of a pie chart, and only that data will be displayed in the other fields on the dashboard.
After you make a selection in a field, Clear filter appears in the top left corner. Selecting this will cancel the selection and display all data again.
Finally, you can also select parts of the legend of a field. However, this will remove this information from the graph and only the data from the other elements will be displayed. Again, the other graphs and tables on the dashboard will adapt to the selection.
Export data
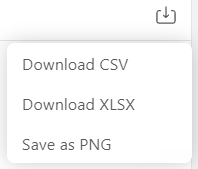
You also have the option of exporting the data and graphics from your dashboards to a CSV, XLSX or PNG file. You will notice that when you move your cursor over a field, the download icon appears in the top right-hand corner. When you select this, you will be given the option of exporting the data to the desired file.
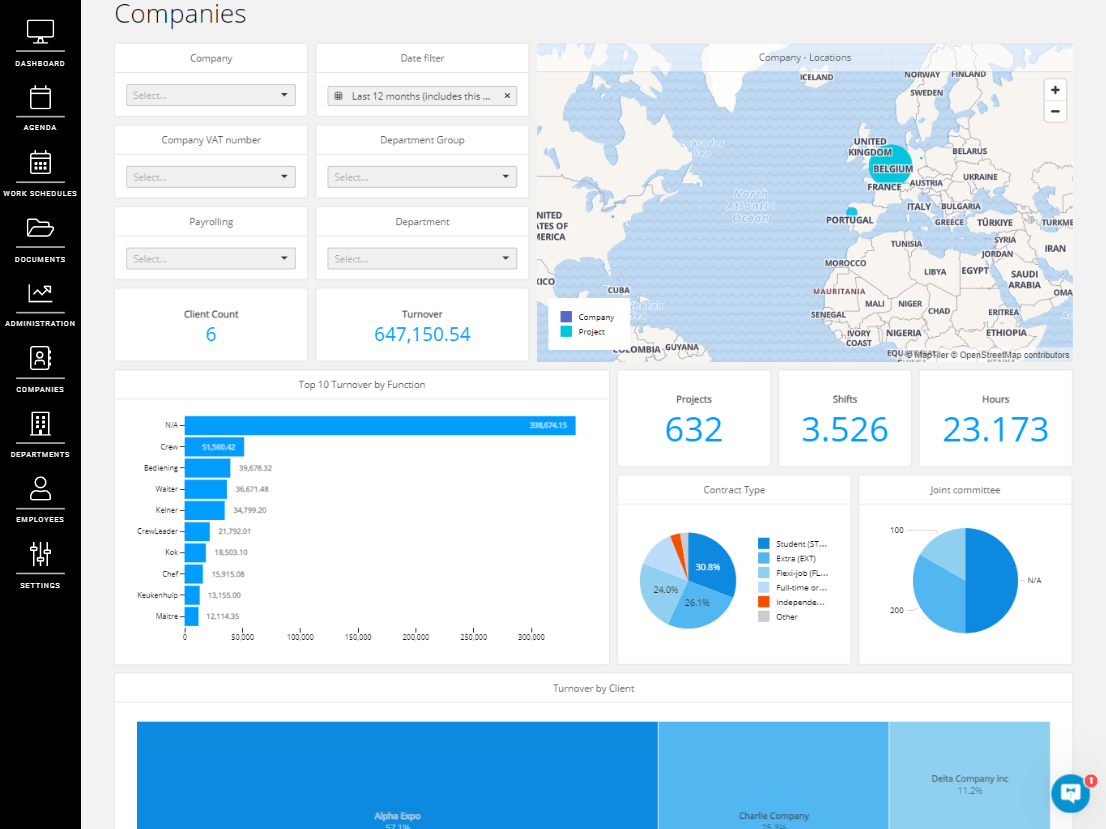
Companies dashboard
On this dashboard, you will find all the statistics concerning your companies. You will not only have project and company locations, turnover, number of projects, shifts and hours, but also, for example, the top 10 turnover per function or top 20 revenue streams.
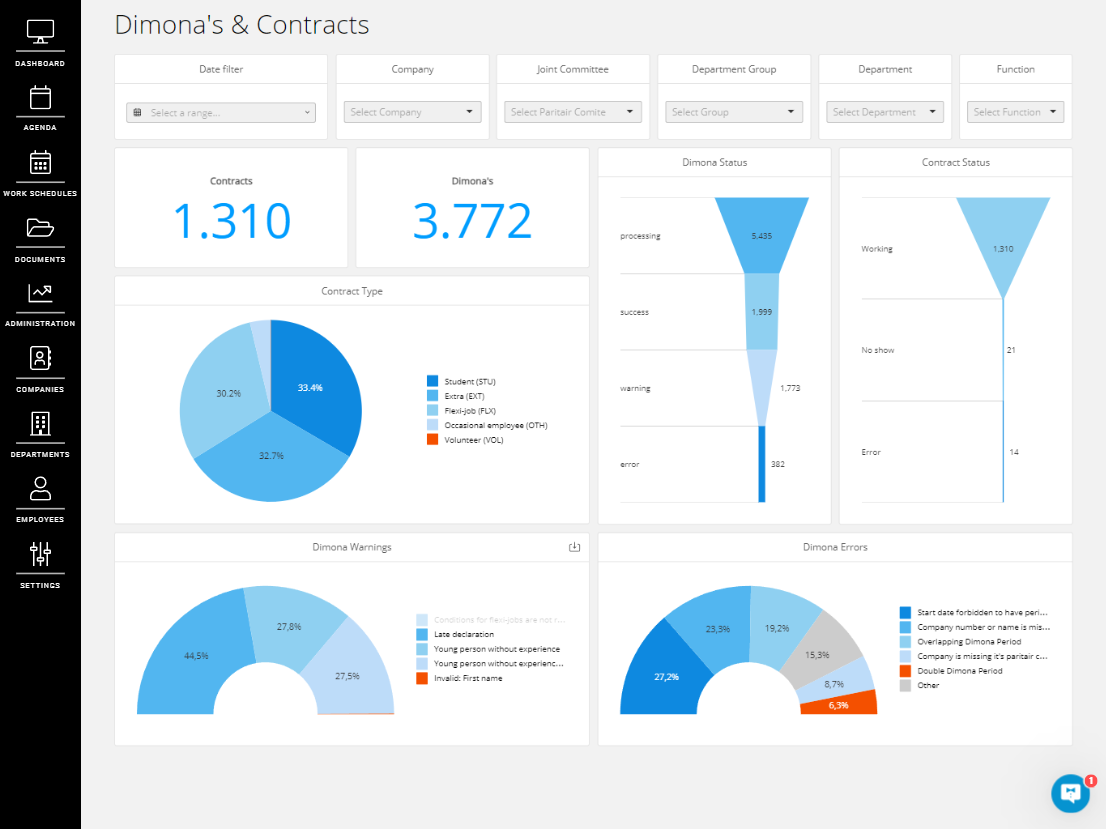
Dimona's & Contracts dashboard
If you use our Dimona integration, or if you generate contracts via the Contract lay-out module or via service partner Offix, you have this board at your disposal. Here you have a clear overview of the number of Dimona's and contracts that have been sent for your company, but also the errors and warnings.
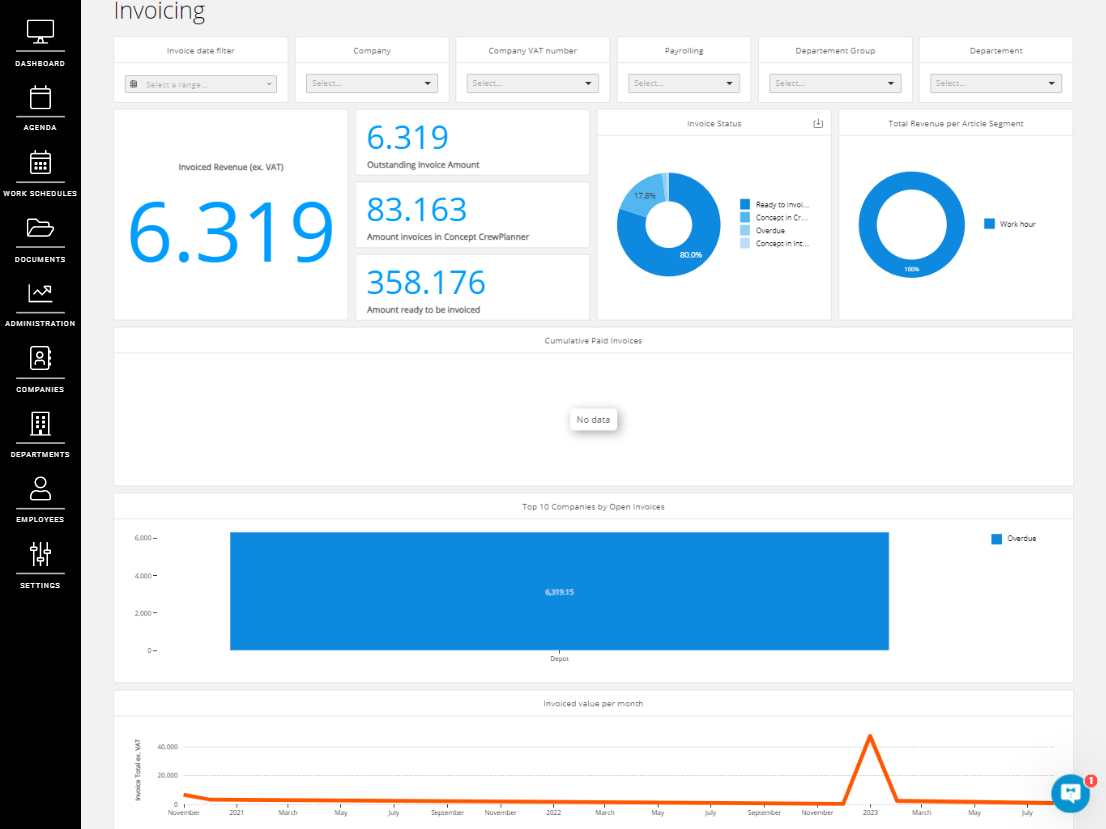
Invoicing dashboard
This dashboard only works in combination with a link to one of our billing partners. You can keep a close eye on outstanding invoices via the billing dashboard. You can consult the percentage of your outstanding invoices via the status graph. Other graphs give you insight into your items, total turnover per contract type, total turnover of the departments, top ten companies with outstanding invoices, top ten employees generating turnover and more.
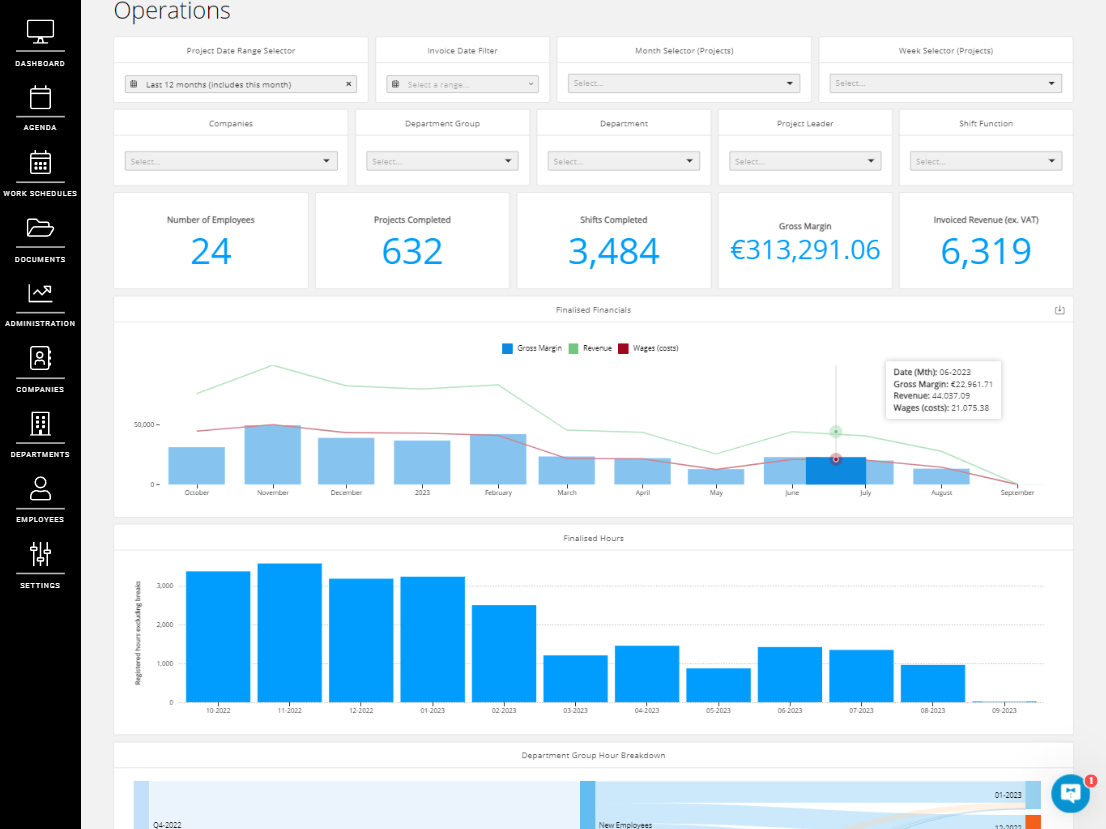
Operations dashboard
As the name suggests, this dashboard contains your operational information. Such as your finalised financial data, finalised hours, breakdown per department group, employee count per department or the margin by project leader.
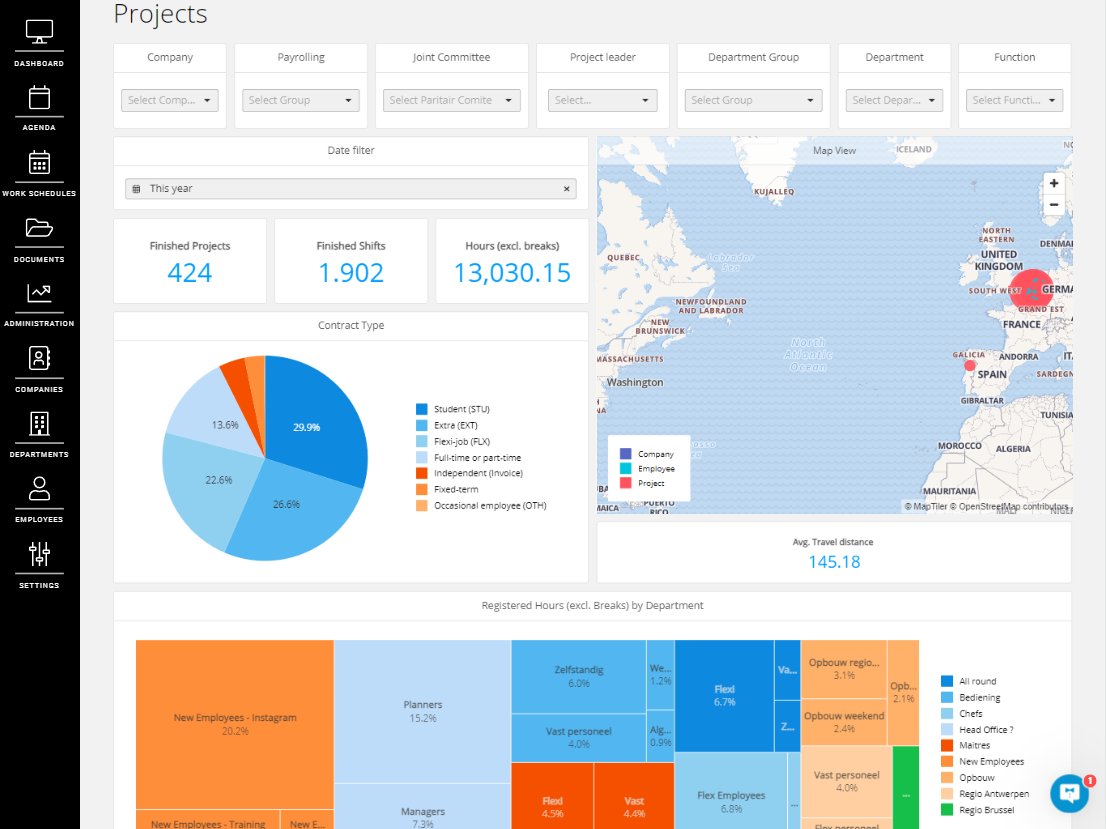
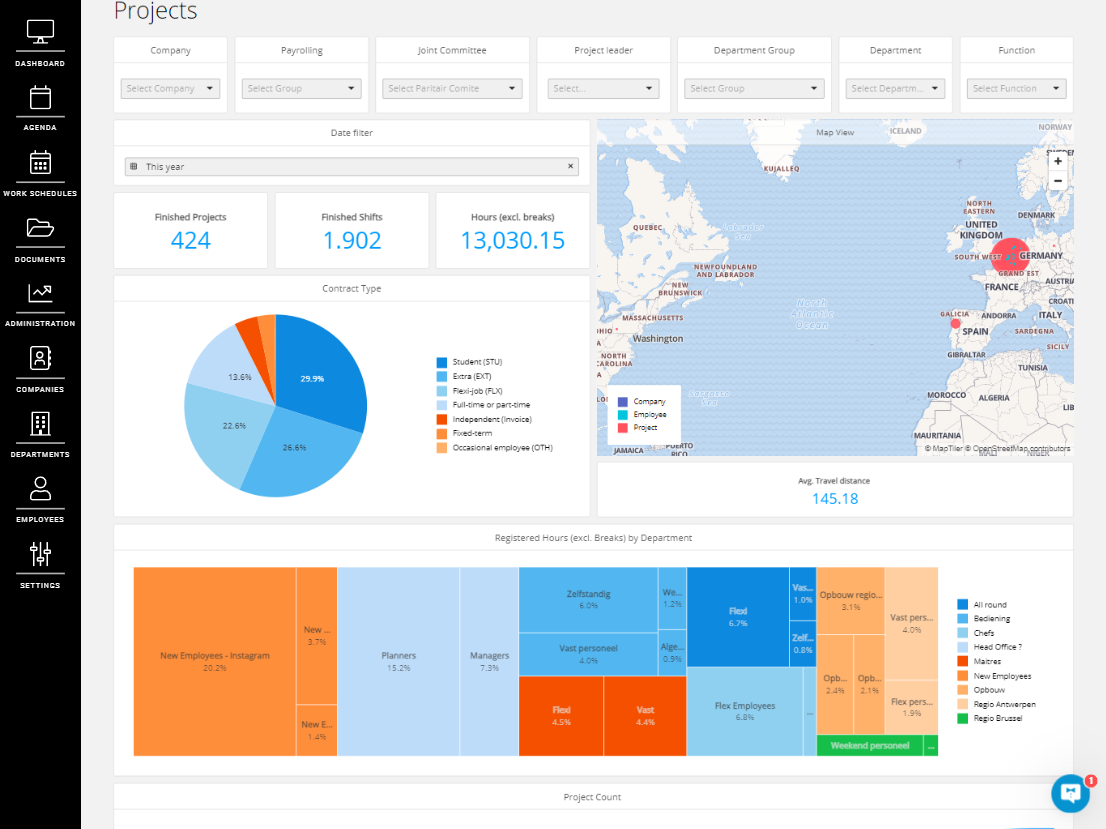
Projects dashboard
On this dashboard you have a collection of different fields with graphs and tables that provide insight into your projects, the performance of the employees on your projects, the top ten project leaders and supervisors, ratings, as well as average pay / costs tables.
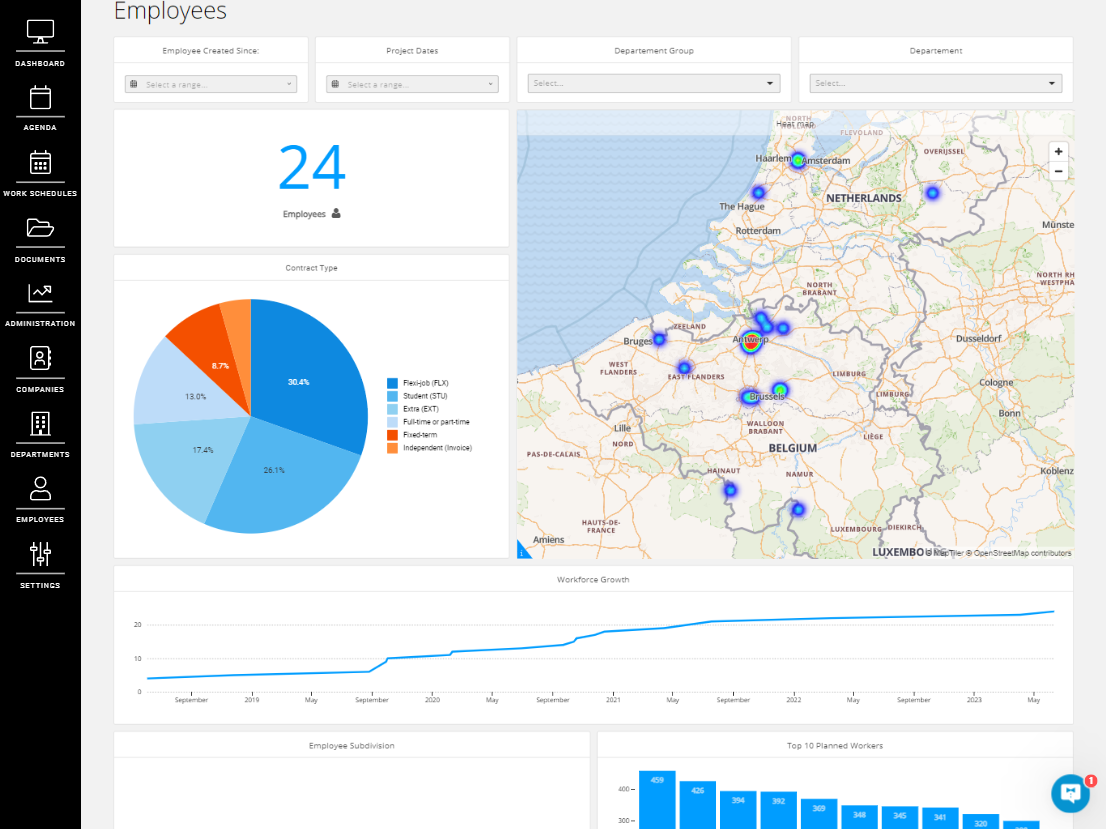
Employees dashboard
This last dashboard shows you the statistics of your employees and their development, gives an overview of the different departments and department groups. In short, a handy overview for example of appraisals, top ten employees of scheduled employees or No shows, car ownership and clothing sizes.
We hope this article has helped you!
If you still have questions, take a look at our Crew Academy first. You might find the answer in one of our articles.